Alerts reported in Xprotect
Xprotect generates alerts for Policy rules and AutoTrust violations seen on Xprotect-managed hosts. The event logs sent to Xprotect from the managed hosts include the details necessary to inspect and remediate the events.
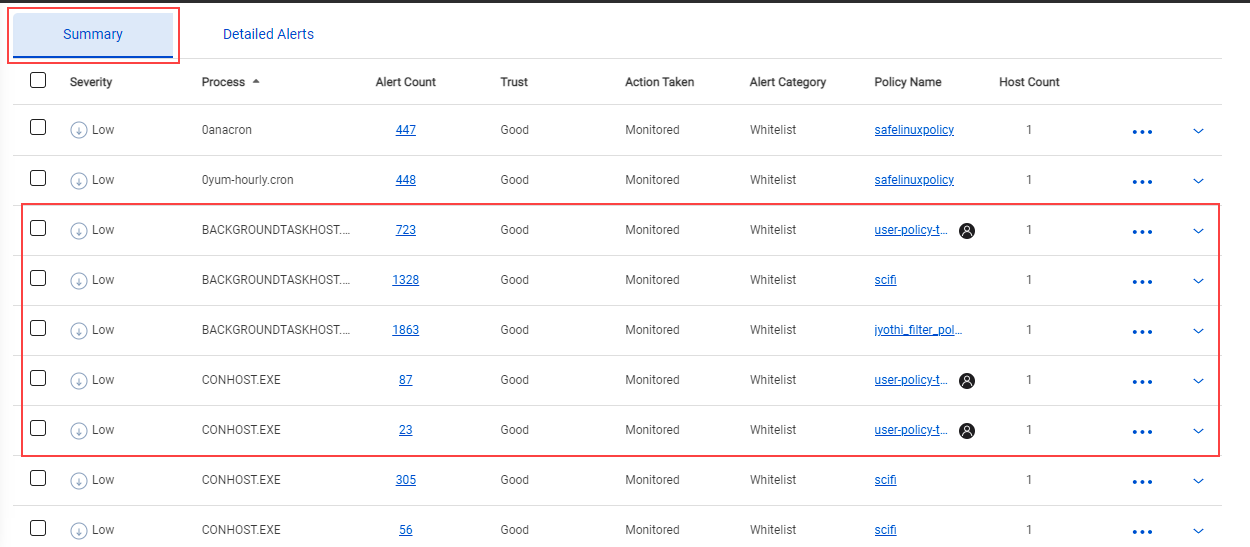
You can see the alerts generated for the instance on the Alerts page. Some of the details you can see as columns on the Alerts pages are Severity, Process, Alert Count (for aggregated views), Alert Category, and Action Taken. Alerts (all or selected) can also be downloaded as a CSV file for offline analysis.
Alerts shown in the UI are for up to the last 30 days. More alerts are stored and available as per the Data Archival settings for the instance.
Summary and Detailed Alerts pages
Alerts are listed on two pages for better usability. The alerts-related tasks available on the pages also differ.
|
Filters the pages and manage alerts to understand the severity of the impact of the events, contain them and take remediation actions.
Alert categories
The following table maps the type of rule that generated the alert to its Alert categories (Alert Category filter) in the Alerts pages.
| Type of rule
|
Alert categories |
|
Whitelist |
Whitelist |
|
Blacklist |
Blacklist |
|
Rule rings |
As Child not Allowed Child Network Connections not Allowed - Network Connections not Allowed Parent not Allowed Rule Rings |
|
File Protect |
File Protect |
|
AutoTrust |
Trust |
Alert reasons
The following table maps the type of rule that generated the alert to the reason for the alert (Alert Reason filter) in the Alerts pages
| Type of rule
|
Alert reasons |
|
Whitelist |
Process not in Whitelist Process not in Whitelist Fingerprint Commandline Process not in Whitelist Path Commandline Process not in Whitelist Path Fingerprint Process not in Whitelist Path Fingerprint Commandline Process Whitelist Fingerprint Calculation Failed Process Whitelist Fingerprint Entry Exists but no Commandline Process Whitelist Path Entry Exists but no Commandline Process Whitelist Path Entry Exists but no Fingerprint Process Whitelist Path Fingerprint Entry Exists but no Commandline |
|
Blacklist |
Process Blacklist Fingerprint Calculation Failed Process in Blacklist Fingerprint Process in Blacklist Fingerprint but no Commandline Process in Blacklist Fingerprint Commandline Process in Blacklist Path Process in Blacklist Path but no Commandline Process in Blacklist Path but no Fingerprint Process in Blacklist Path Commandline Process in Blacklist Path Fingerprint Process in Blacklist Path Fingerprint but no Commandline Process in Blacklist Path Fingerprint Commandline |
|
Rule ring |
No Child Process is Allowed Process all Childs Disallowed for Network Connections Process in Network Connections Disallowed Paths Process in Network Connections Disallowed Childs of Parent Process is Child of Disallowed Parent Process not Allowed as Child Explicitly Process not in Allowed Child List Process not in Allowed Network Connections Childs of Parent Process not in Network Connections Allowed Paths Process Parent is not in Allowed Parent |
|
File Protect |
File Access Violation |
|
AutoTrust |
Process Bad Trust |
Enable alerts
In Xprotect, alerts generated for rules in the Monitor mode are always reported. You can choose to receive alerts for rules in the Enforce mode. Some types of rules can be set to Monitor or Enforce mode (with alerts) at the rule level or in the Policy settings of the relevant policies.
| Type of rule
|
Rule-level | Policy-level setting |
|
Whitelist |
Status - Active or Paused |
Status - Active or Paused Behavior - Monitor, Enforce, and Log Alert |
|
Blacklist |
Status - Active or Paused Behavior - Monitor, Enforce, Log Alert, and Follow Global |
Status - Active or Paused Behavior - Monitor, Enforce, and Log Alert |
|
Rule rings |
Status - Active or Paused Behavior - Monitor, Enforce, and Log Alert |
Status - Active or Paused |
|
File Protect |
Status - Active or Paused Behavior - Monitor, Enforce, and Log Alert |
Status - Active or Paused Behavior - Force Monitor |
When rules are Paused in the Policy settings, the statuses of the individual rules are overridden. It is important that you verify the rule level settings and Policy settings of the critical rules to ensure that you obtain the relevant alerts.
Filter alerts
Filter alerts to see a focused view of the alerts on the Alerts pages. The filters available on the pages differ slightly. Alerts can be filtered by multiple criteria (filters) such as the Process that caused the alert, Process scopes (path, MD5, command line, and so on), Alert category (type of rule that caused the alert), Severity, and the Action taken for the alert.
Filter queries can also be saved as public or private Bookmarks to load the custom views of the Alerts pages quickly.
Investigate alerts
Monitor the alerts regularly to ensure that you investigate events before they seriously affect the infected host and the interconnected hosts. The alerts generated in Xprotect provide details about the time when the event occurred, the hosts and processes involved in the event, and the current action taken for the event.
